Data & analytics: turning inpeek's internal data into real knowledge
inpeek’s internal data from the SAP Business ByDesign system (time recording and project administration) and from the CV Reference Tool (CV maintenance and knowledge management) was to be processed, analyzed and visualized. The aim was to enable internal stakeholders – such as management, account management or the sales team – to make more informed decisions both in day-to-day business and at a strategic level.
THE CHALLENGES
The main task was to design transparent, scalable and flexible data pipelines for automated data preparation as well as suitable data modeling tailored to inpeek's information requirements and issues.
In the context of the ByDesign data, the focus was particularly on project key figures, and the modeling was to be based on these. The analytical model for the CV data was less obvious and required a little more creativity: among other things, the aim was to answer which skills had been used by which employees, when, how often, in which projects and in which industries.
THE CHALLENGES
The main task was to design transparent, scalable and flexible data pipelines for automated data preparation as well as suitable data modeling tailored to inpeek’s information requirements and issues.
In the context of the ByDesign data, the focus was particularly on project key figures, and the modeling was to be based on these. The analytical model for the CV data was less obvious and required a little more creativity: among other things, the aim was to answer which skills had been used by which employees, when, how often, in which projects and in which industries.
OUR APPROACH
To create the data basis, we rely on SAP Datasphere, an open data platform in the cloud. SAP Datasphere offers a comprehensive toolbox for data engineering as well as numerous ready-made connectors for connecting various source systems. The ByDesign data is retrieved via the OData connector, the CV data via the SAP HANA connector. Data is processed in batch mode, and the Star Schema was chosen as the modeling approach for designing the analytical models. The data pipelines have a layered architecture with physical and virtual gradation. Generic transformations (such as cleansing) take place early in the process with a view to reusability and performance, while use case-specific transformations and modeling only take place downstream in the virtual layer in order to retain flexibility for further, future use cases.
The prepared data is then brought to life in the SAP Analytics Cloud (SAC) in so-called “stories”. In doing so, we make targeted use of the interactive functionalities of the SAC, which allow users to interact with the dashboards and thus provide them with optimal support for exploratory data analysis.
THE RESULT
Direct efficiency gains have been realized in data preparation and report generation: The automated preparation of the data noticeably improves performance, reduces errors, increases confidence in the data basis and saves a lot of time – leaving more for the actual analysis of the data in the end.
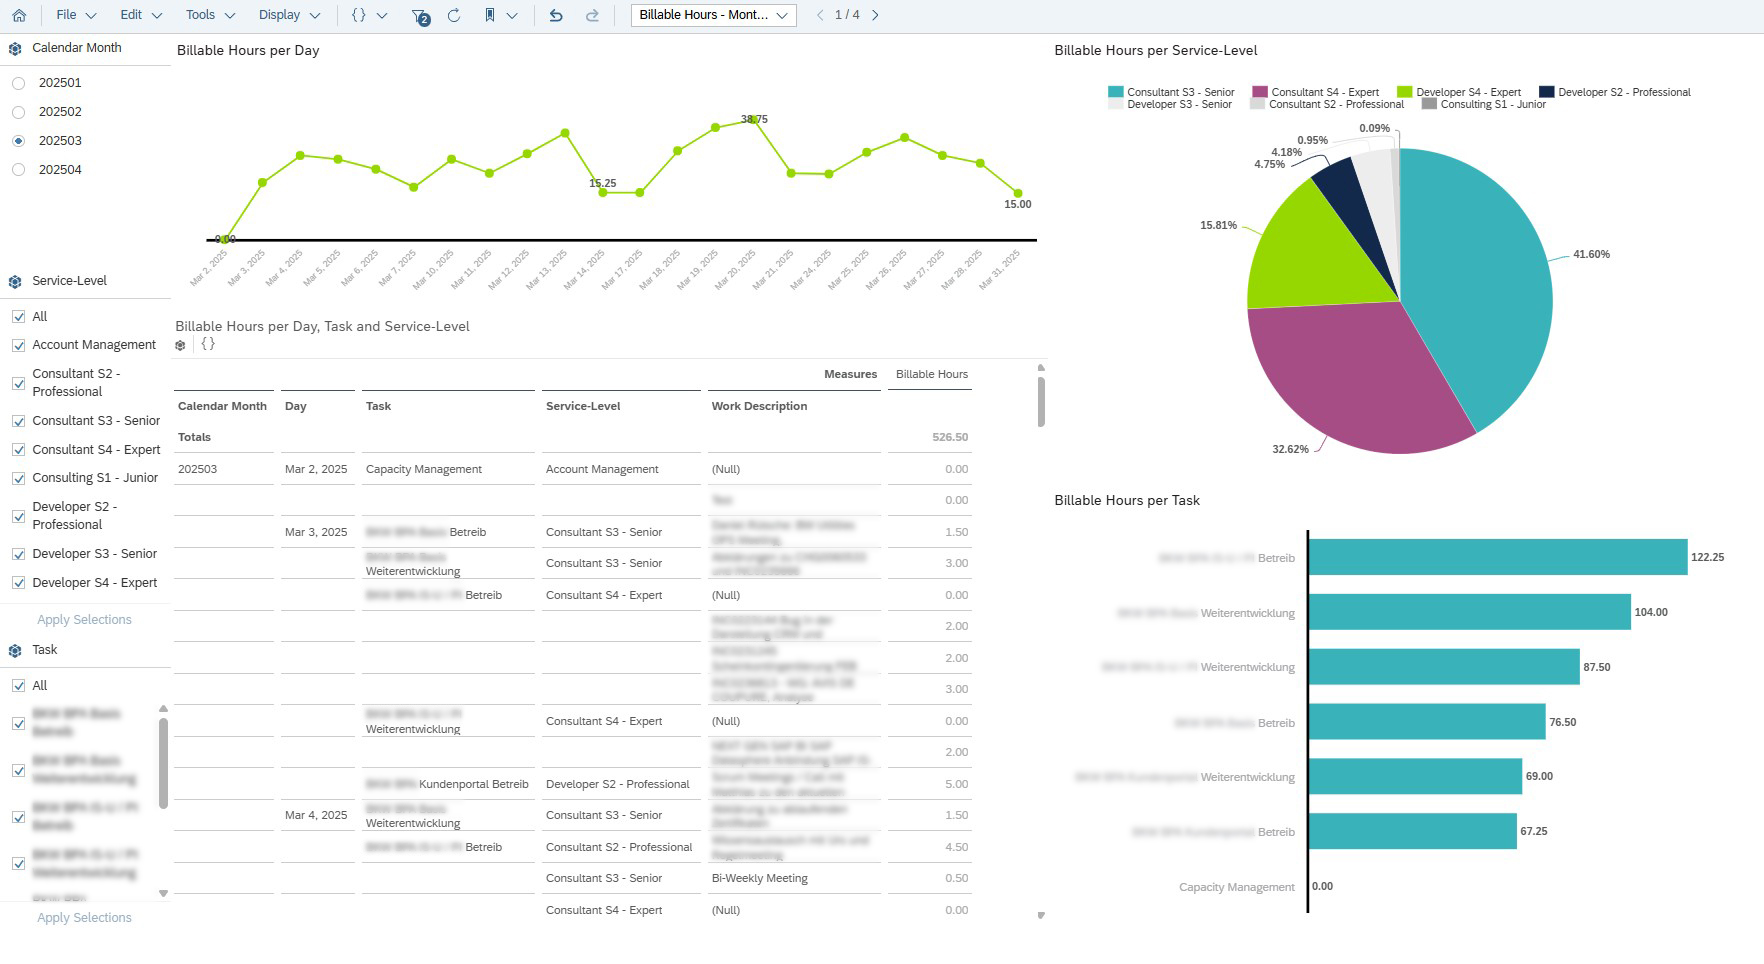
The solution also supports the generation of valuable information from the data. In the ByDesign use case, for example, the monthly review is made much easier for account managers. Quick, targeted research on a specific topic or project task is made possible, as is interactive exploration of the events of the past month, e.g. using an overview of billable hours.
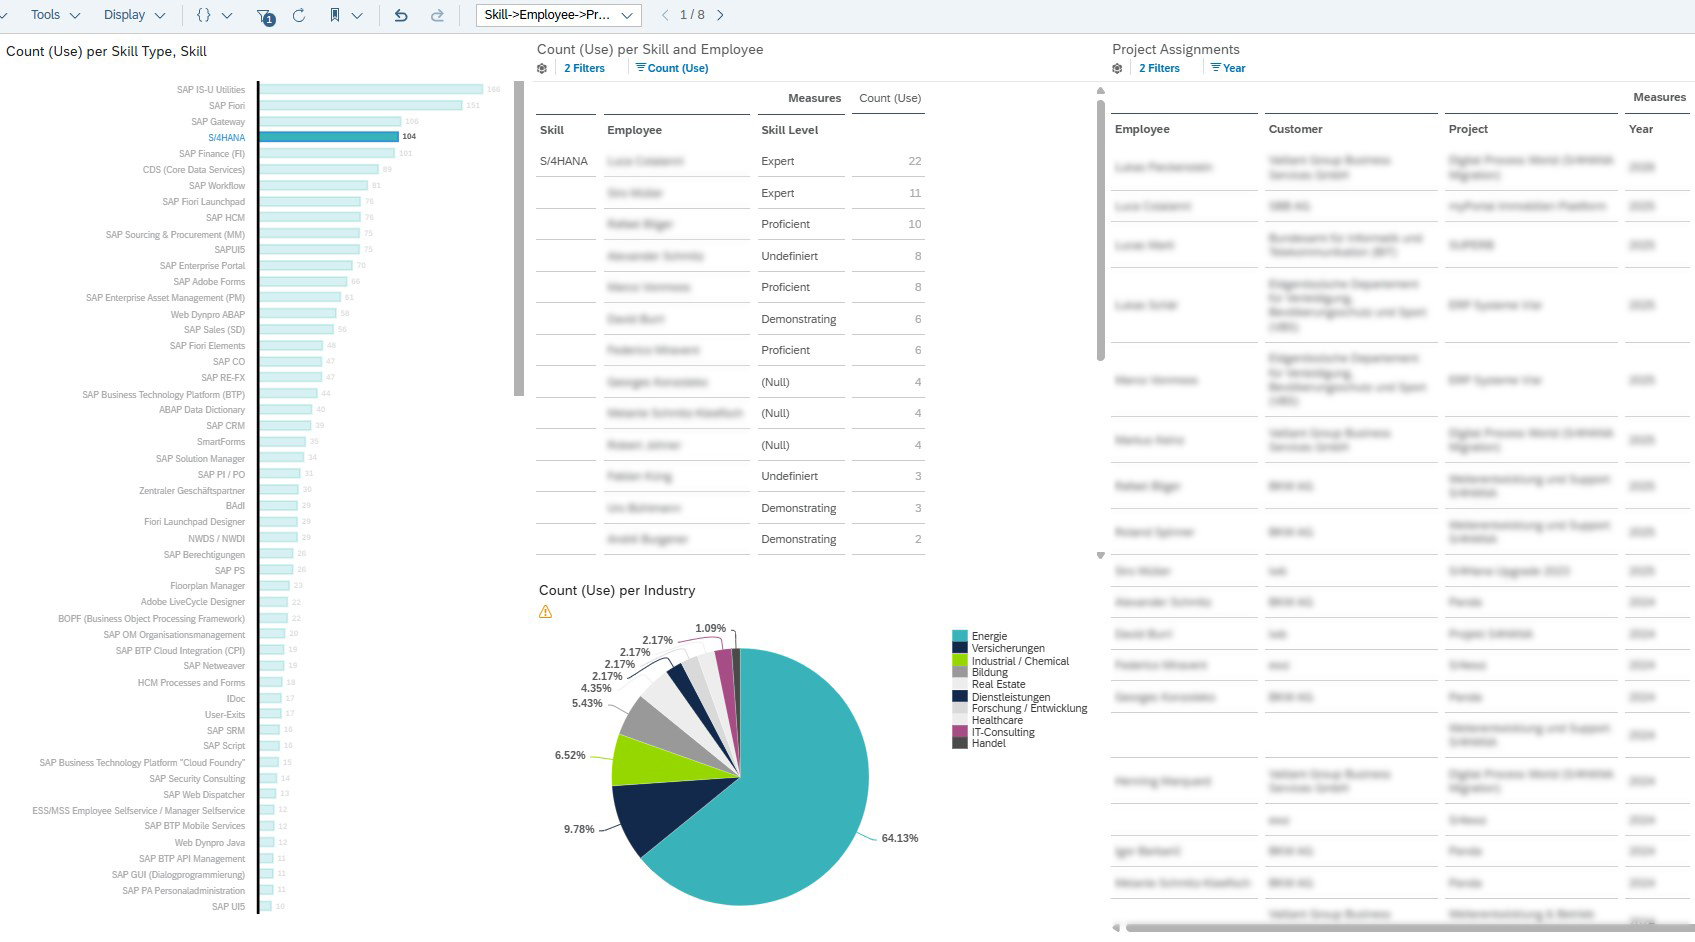
The SAC stories based on the CV Reference Tool data provide excellent services to the inpeek sales team, for example, which often has to find suitable employees and reference projects based on a specific skill in tenders, sometimes also taking industry relevance into account. This is supported by a dashboard that quickly provides an overview of who has already used the required skill, how often, in which industries, when and in which projects.
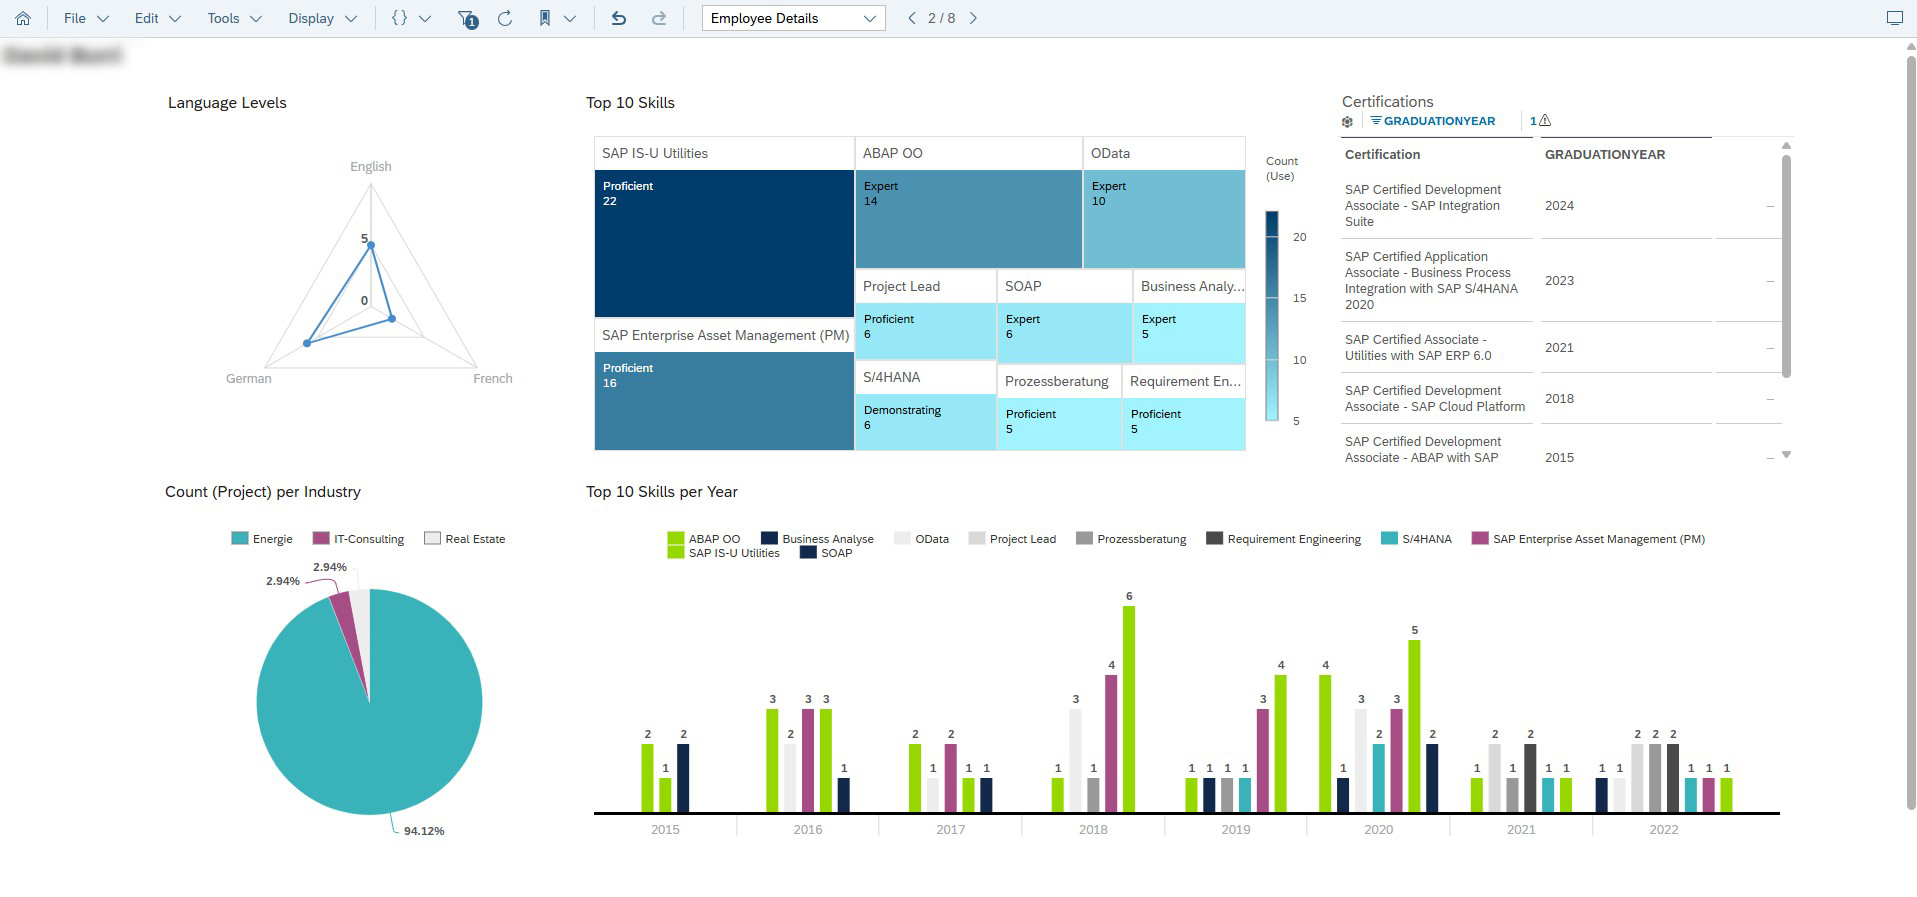
An employee page provides additional information about the person, their language skills, certifications, industry experience and the top 10 most frequently used skills.
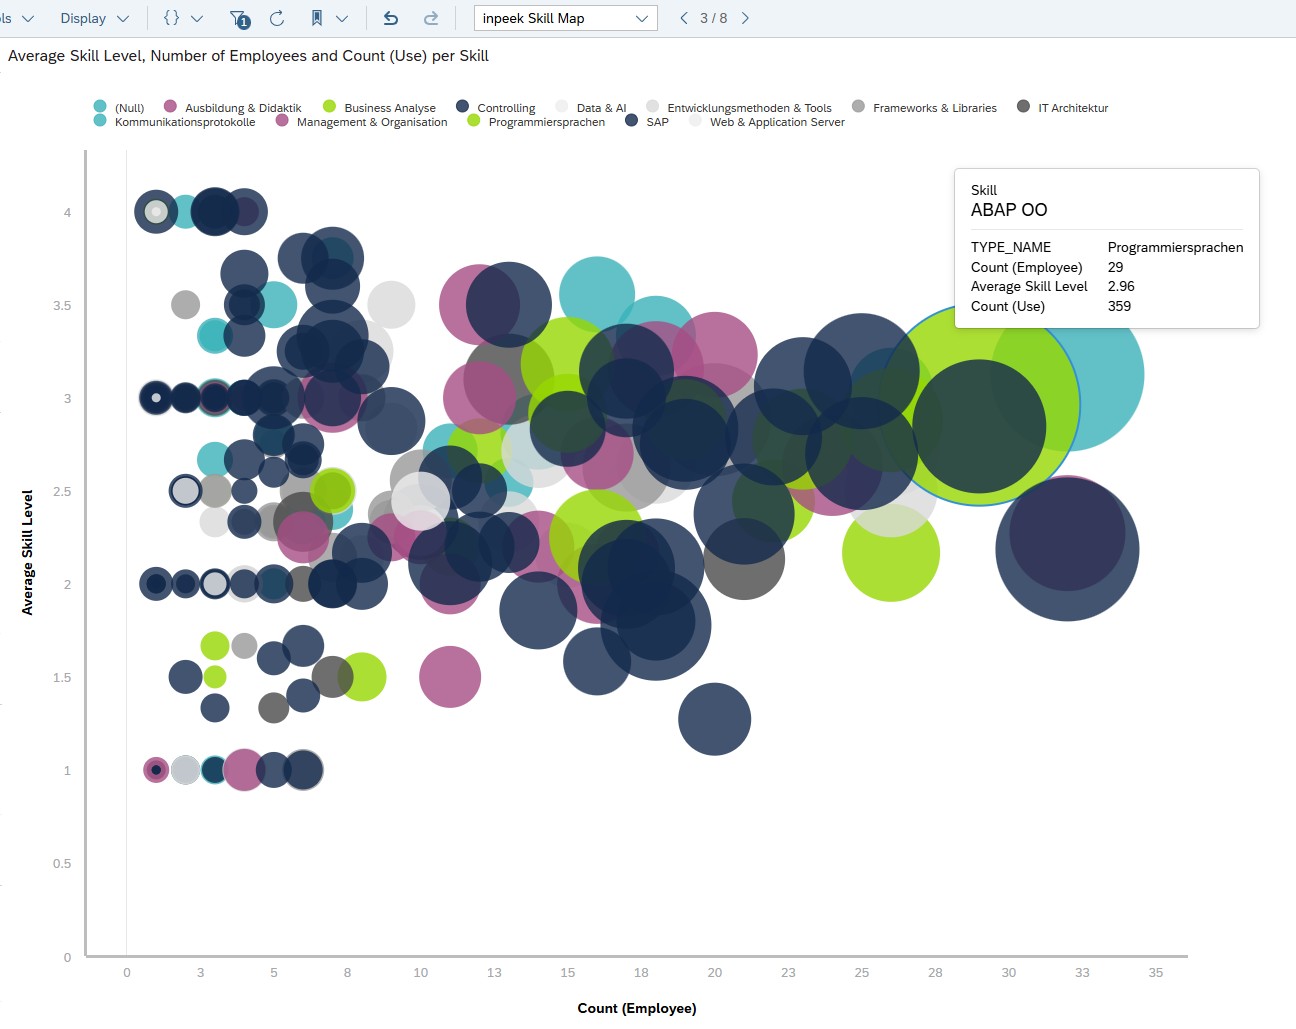
The “inpeek Skill Map” serves as an alternative entry point for the sales team when searching for talent. Above all, however, it provides a graphical overview of inpeek’s expertise as a whole, viewed from a bird’s eye perspective, and thus supports management in strategic positioning and decision-making. Each bubble represents a capability; the size of the bubble is determined by the number of times this capability is used in a project. The position of the bubble results from the number of employees who have the corresponding skill (x-axis) and the average skill rating for the skill (y-axis). The “inpeek Skill Map” thus shows at a glance the experience per skill (size of the bubble), the average self-assessment (rating) and how broadly based the knowledge is (number of employees). On this basis, clear growth targets can be defined and appropriate measures derived, the success of which can be monitored in a targeted manner.
THE RESULT
Direct efficiency gains have been realized in data preparation and report generation: The automated preparation of the data noticeably improves performance, reduces errors, increases confidence in the data basis and saves a lot of time – leaving more for the actual analysis of the data in the end.
The solution also supports the generation of valuable information from the data. In the ByDesign use case, for example, the monthly review is made much easier for account managers. Quick, targeted research on a specific topic or project task is made possible, as is interactive exploration of the events of the past month, e.g. using an overview of billable hours.
The SAC stories based on the CV Reference Tool data provide excellent services to the inpeek sales team, for example, which often has to find suitable employees and reference projects based on a specific skill in tenders, sometimes also taking industry relevance into account. This is supported by a dashboard that quickly provides an overview of who has already used the required skill, how often, in which industries, when and in which projects.
An employee page provides additional information about the person, their language skills, certifications, industry experience and the top 10 most frequently used skills.
The “inpeek Skill Map” serves as an alternative entry point for the sales team when searching for talent. Above all, however, it provides a graphical overview of inpeek’s expertise as a whole, viewed from a bird’s eye perspective, and thus supports management in strategic positioning and decision-making. Each bubble represents a capability; the size of the bubble is determined by the number of times this capability is used in a project. The position of the bubble results from the number of employees who have the corresponding skill (x-axis) and the average skill rating for the skill (y-axis). The “inpeek Skill Map” thus shows at a glance the experience per skill (size of the bubble), the average self-assessment (rating) and how broadly based the knowledge is (number of employees). On this basis, clear growth targets can be defined and appropriate measures derived, the success of which can be monitored in a targeted manner.

ABOUT INPEEK
We are a young IT technology company specializing in consulting and development services in the SAP environment. Based on a strong technological foundation, we offer innovative, user-friendly and practical solutions for a wide range of business areas and industries – and we do so in a highly agile manner and always with passion.
